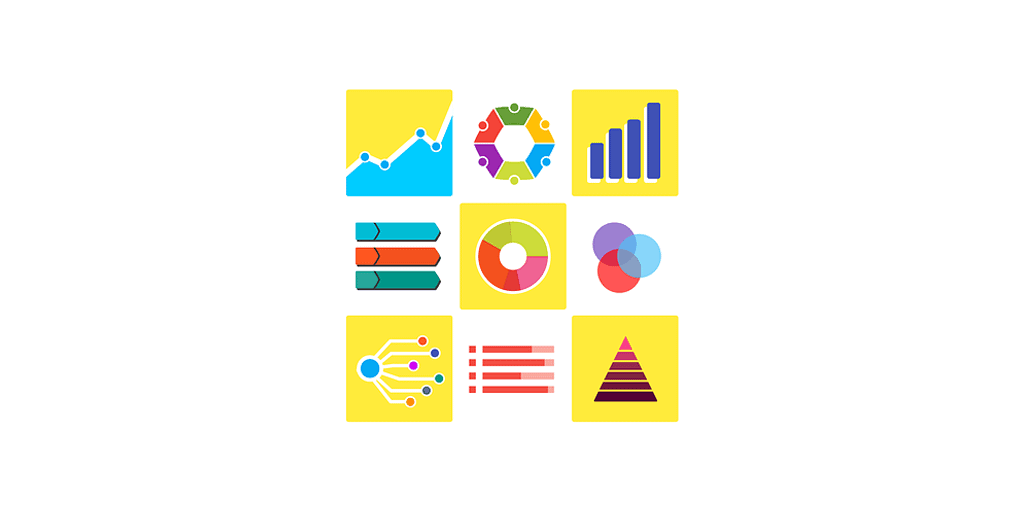
Infographics are visual images that help break down complicated information. They offer strong visual hooks to translate complex data into easily digestible chunks.
A quick scan of Pinterest will reveal dozens of colorful, eye-catching infographics. Why are they important? And how can you use them in instructional design?
Why should you use infographics?
It’s important to use visual aids like infographics because they:
- Occupy less space
- Easily illustrate complex data like statistics
- Bridge gaps to relate concepts
- Simplify processes
Want to create an infographic yourself? Click here to read my previous blog for directions and links to free tools!
How can you incorporate infographics into eLearning Instructional Design?
Infographics and eLearning have much in common. They both share information as a visual medium. Parallels include focused information, data visualization, and an emphasis on the importance of color and typography.
As an eLearning designer, you can tap into the power of infographics to help you:
- Tell a story that spans across time
- Compare and contrast data
- Associate a connection
- Explain a process
If infographics appeal to you, click here for examples of ways to use them in your eLearning design.

